Overview
This entry documents gross transfer expenditure, net spend, and the distinction between cash payments and accounting treatment. Under IFRS, player registrations are treated as intangible assets and amortised over the contract length.1 When United signs a player for £80 million on a six-year contract, the annual P&L charge is £13.3 million - not £80 million. The full cash obligation is committed at signing but expressed in financial statements over time.
This accounting methodology creates a material gap between headline transfer fees, P&L charges, and actual cash outflows - a gap that is central to understanding United's financial position.
Long-Term Aggregate Spending
Between 2012 and 2022, CIES Football Observatory calculated that United spent €1.5 billion on transfers while recouping €467 million in sales - a net spend exceeding €1 billion.2 Sky Sports reported net spend of £903 million during the decade to 2021,3 while more recent analysis indicated £1.16 billion net spend over the decade to 2025 - making United the only Premier League club to exceed £1 billion in this metric.4
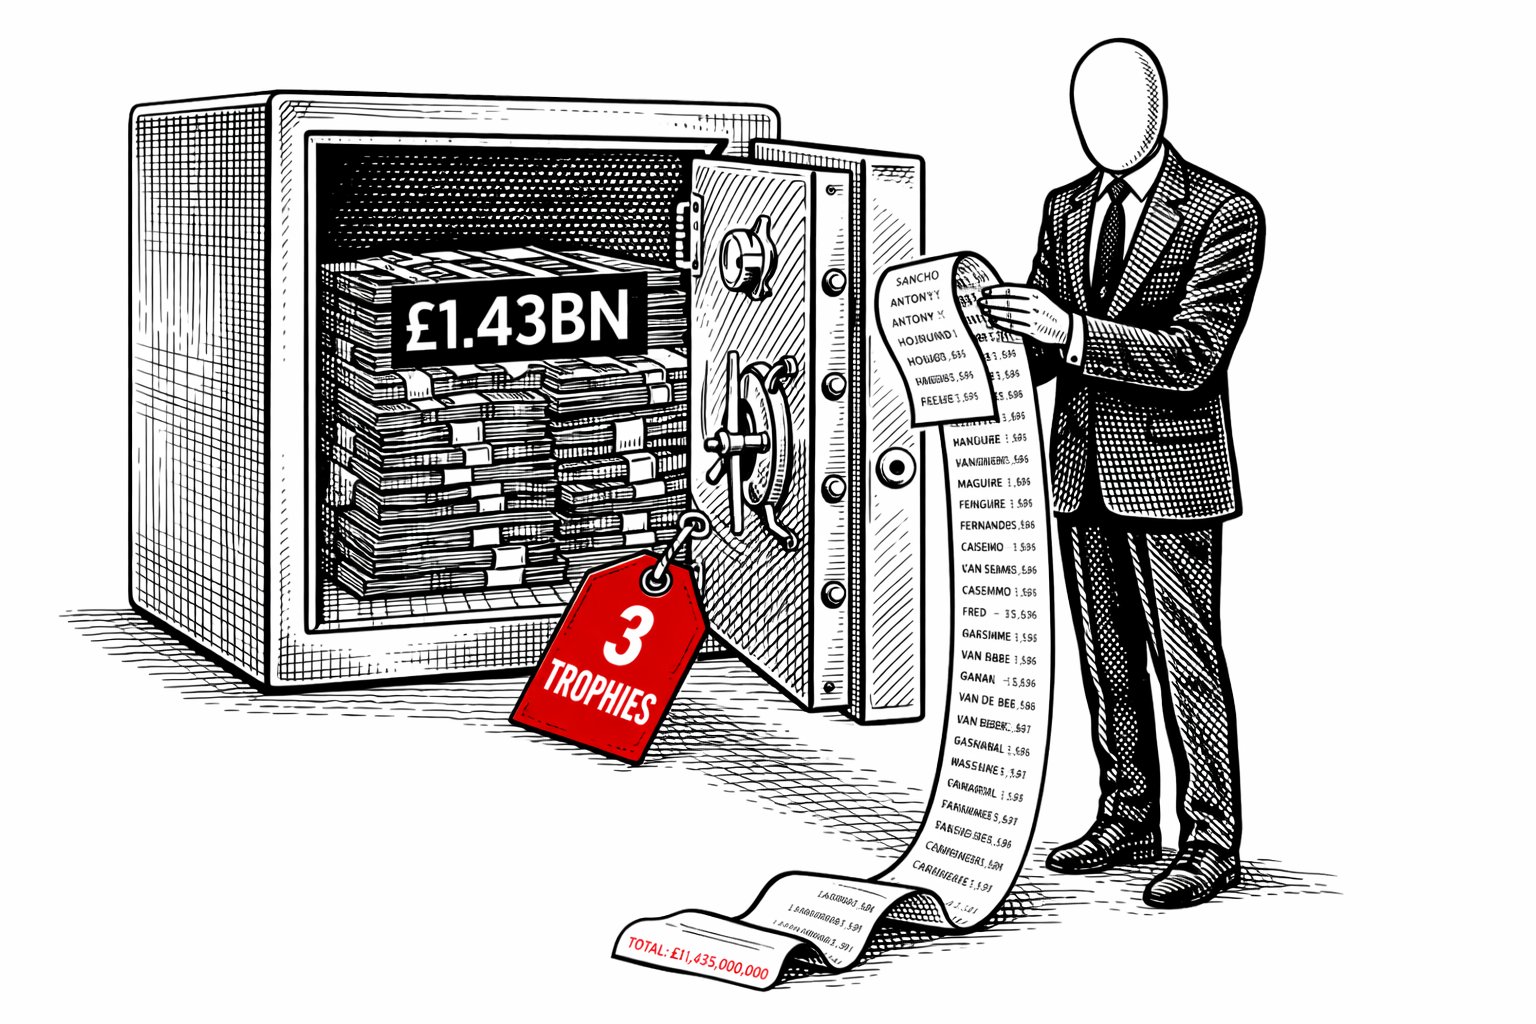
Sky Sports calculated £1.43 billion in gross spending between 2013 and 2023,5 a period during which United won only three trophies. These figures represent headline values rather than actual cash paid.
Cash Payment Structures
The widespread adoption of instalment payments has become industry norm. United's SEC filings confirm that "when acquiring or selling players' registrations it is normal industry practice for payment terms to spread over more than one year."6
Recent examples illustrate standard structuring: the £62.5 million acquisition of Matheus Cunha was paid in three instalments, with United initially requesting a five-year schedule.7 The £65 million fee for Bryan Mbeumo was structured in four instalments, requiring only £16.25 million upfront.8 As Kieran Maguire explained: for transfers totalling £130 million, United's immediate cash requirement was approximately £37 million.8
The cumulative effect creates substantial ongoing liabilities. As of September 2024, United owed £319 million in transfer fee instalments for past signings, with at least £154 million due within twelve months.9 By early 2025, the club owed £175.5 million in net transfer payments due before March 2026.10
Accounting Profit on Disposals
The accounting treatment of player sales creates a significant asymmetry. While purchase costs are amortised gradually, profit from sales is immediately recognised in full.11 Accounting profit on disposal equals cash received minus the player's remaining book value - creating scenarios where sales at substantial discounts to original cost generate accounting profits.
Aaron Wan-Bissaka, originally signed for £50 million in 2019 and sold to West Ham for £20 million in 2024, generated a £12 million accounting profit despite the £30 million cash loss.12 Swiss Ramble noted that the £49 million profit on disposals in 2023/24 represented United's "best result for 16 years,"13 yet the club has "historically struggled to generate significant income from player sales, unlike Manchester City, Liverpool and Chelsea."14
PSR Context
The distinction between cash and accounting is critical for Profit and Sustainability Rule compliance. Amortisation reduces reported profit but has no impact on immediate cash flow.15 As Kieran Maguire explained: "When a club signs a player, the cost is actually spread over the life of the contract. So in the case of Matheus Cunha, it's £1 million per month - not £60 million that's going out of the PSR calculation."16
Sir Jim Ratcliffe publicly stated that "Manchester United would have run out of cash by the end of 2025" without cost-cutting measures,17 contextualising the club's 2024/25 summer activity - £214 million gross in calendar year 2025 - against a backdrop of £73.2 million in cash reserves as of March 2025.18
Summary
Manchester United's transfer activity since Sir Alex Ferguson's 2013 retirement represents the most sustained high-volume spending in the club's history: £1.43 billion gross between 2013 and 2023, with a net spend of £1.16 billion over the decade to 2025 - the only Premier League club to exceed £1 billion. This investment generated three trophies in that period.
The gap between headline fees and actual cash flows is structural. Multi-year instalment arrangements, amortisation accounting, and deferred obligations mean that the cash reality of transfer activity differs materially from both the P&L presentation and the headline valuations cited in media reporting. As of late 2024, United carried £319 million in deferred transfer payables - a figure that shapes the club's liquidity position independently of its reported profit or loss.
References
- 1.Manchester United / IFRS (various). Player registration accounting treatment. Form 20-F filings. ir.manutd.com
- 2.CIES Football Observatory (2022). Transfer expenditure 2012–2022. football-observatory.com
- 3.Sky Sports (2021). Manchester United net spend decade to 2021. skysports.com
- 4.Swiss Ramble / Sky Sports (2025). Net spend decade to 2025 - only PL club above £1Bn. @SwissRamble
- 5.Sky Sports (2023). Manchester United gross transfer spend 2013–2023. skysports.com
- 6.Manchester United (2024). Form 20-F - transfer payment terms note. ir.manutd.com
- 7.FootyFinance / Sky Sports (2025). Cunha payment structure. skysports.com
- 8.Kieran Maguire / Sky Sports (2025). Mbeumo instalment structure; cash vs. headline fee. skysports.com
- 9.Manchester United (2024). Q1 FY2025 SEC filing - transfer payables. ir.manutd.com
- 10.United in Focus / FootyFinance (2025). Transfer obligations due before March 2026. unitedinfocus.com
- 11.The Price of Football / Swiss Ramble (2024). Player disposal accounting mechanics. @SwissRamble
- 12.Swiss Ramble (2024). Wan-Bissaka disposal - accounting profit vs. cash loss. @SwissRamble
- 13.Swiss Ramble (2024). Manchester United disposal profit - best for 16 years. @SwissRamble
- 14.United in Focus (2025). United historically poor at generating sales income. unitedinfocus.com
- 15.Swiss Ramble (2024). Amortisation - non-cash nature. PSR methodology. @SwissRamble
- 16.Kieran Maguire / Sky Sports (2025). Amortisation vs. cash - Cunha example. skysports.com
- 17.Sir Jim Ratcliffe / Sky Sports (2025). United would have run out of cash. skysports.com
- 18.United in Focus (2025). Cash reserves March 2025; RCF position. unitedinfocus.com