Overview
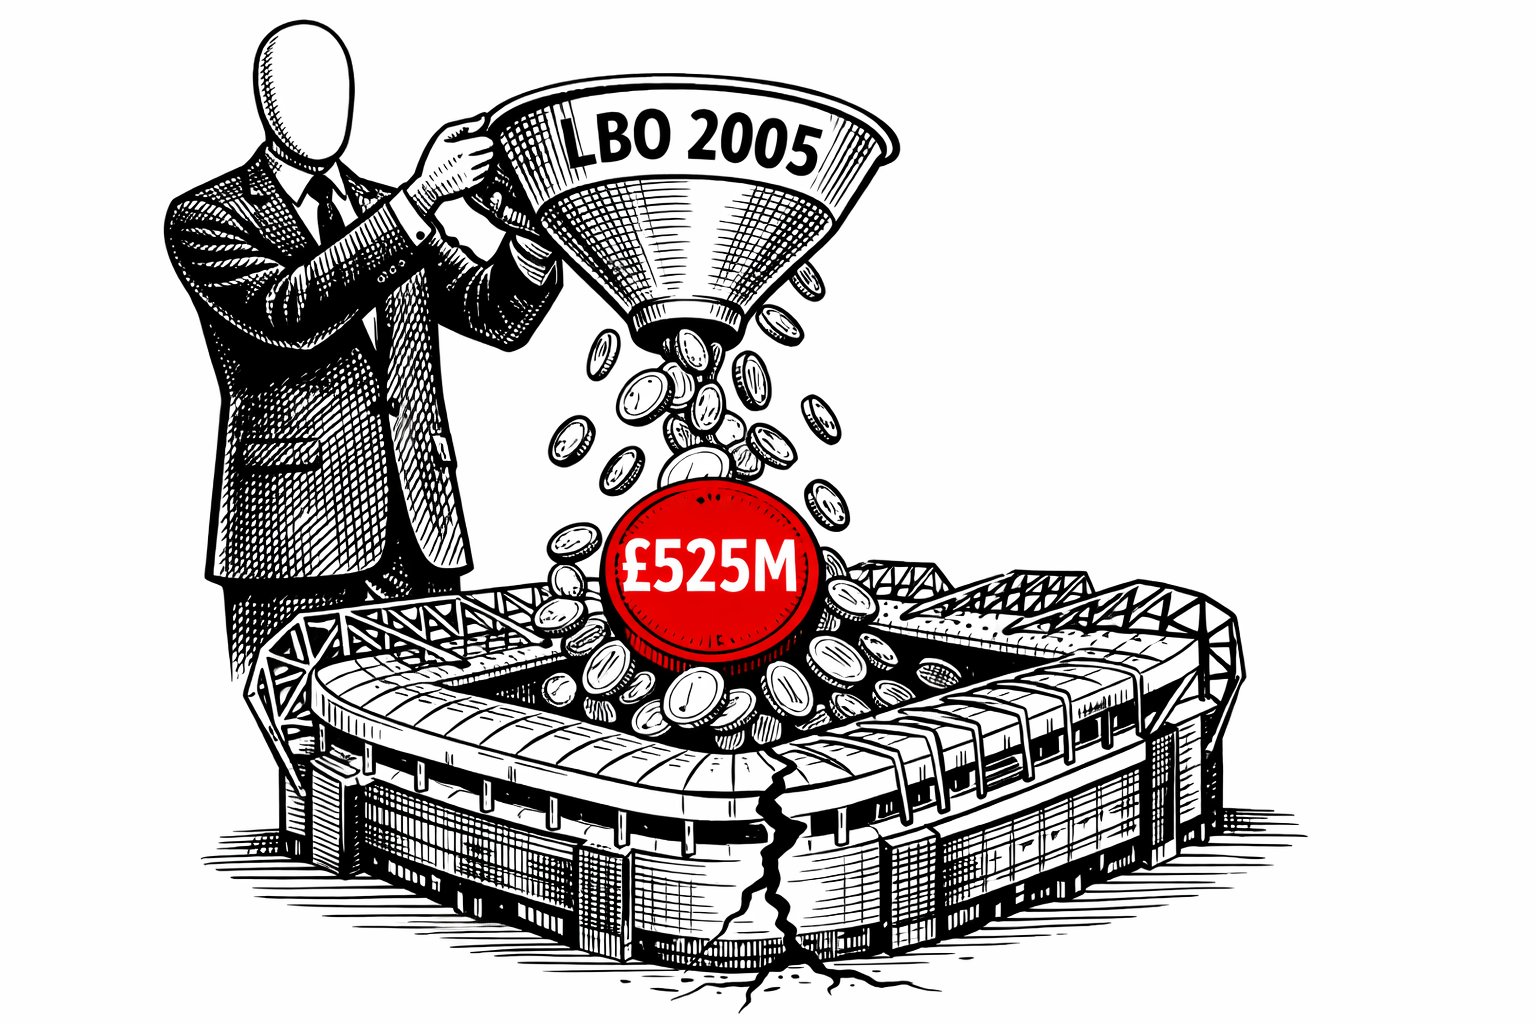
Debt has been a defining structural feature of Manchester United's finances since May 2005, when the Glazer family completed a leveraged buyout of the club for approximately £790 million.1 The acquisition was structured using leveraged buyout techniques, placing approximately £525 million of acquisition debt directly onto Manchester United's balance sheet rather than onto the purchasing family.2
The debt placed on the club in 2005 comprised multiple tranches: senior bank debt facilities of £265 million arranged by JP Morgan,3 and payment-in-kind (PIK) loans from hedge funds totalling approximately £138 million at an initial interest rate of 14.25%.4 The PIK loans were structured such that interest compounded rather than being paid in cash, causing the debt to grow automatically over time.
Since 2005, Manchester United's debt has undergone several structural transformations - from bank debt and PIK loans, to high-yield bonds, to term loans and revolving credit facilities - while remaining a consistent presence on the balance sheet. As of September 2025, net debt reached £749 million ($1.002 billion), surpassing $1 billion for the first time in the club's history.85
Timeline of Key Debt Developments
2005: The Leveraged Buyout
The Glazer family's acquisition in May 2005 was structured as a leveraged buyout (LBO), resulting in the club being taken private and delisted from the London Stock Exchange.1 The financing structure comprised:
- Senior bank debt: £265 million arranged by JP Morgan3
- PIK loans (first tranche): ~£138 million at 14.25% interest4
- PIK loans (second tranche): ~£137 million, bringing total PIK exposure to ~£275 million5
The PIK loan structure was particularly significant. Unlike conventional debt where interest is paid periodically, PIK interest compounds - unpaid interest is added to the principal. By June 2006, the first PIK tranche had grown from £138 million to £156.4 million due to accrued interest.6 The interest rate was subsequently increased to 16.25%.7
2006–2009: PIK Compounding and Crisis Risk
Throughout this period, the PIK loans continued to compound. By 2007 the PIK portion had grown to approximately £200 million,8 and by 2009 had reached approximately £220 million.10 Total debt including PIK loans was estimated at over £700 million. The 2008–2009 global financial crisis created significant refinancing risk.9
2010: Bond Issue and PIK Repayment
In January 2010, Manchester United issued £500 million in senior secured bonds, representing a structural shift from bank debt to capital markets debt.11 The bond issue comprised £250 million of sterling notes at 8.75% and $425 million of dollar notes at 8.375%.12 Proceeds were used to repay the PIK loans in full.13
2012: Initial Public Offering
Manchester United completed an IPO on the New York Stock Exchange in August 2012, raising $233 million.19 Ahead of the IPO, gross debt stood at approximately £423 million and net debt at £359.7 million.17,18 The IPO prospectus included risk factor disclosures noting that substantial indebtedness could adversely affect financial condition.22
2013: Refinancing to Lower-Cost Debt
In June 2013, Manchester United entered into a $233.3 million senior secured term loan facility at LIBOR plus 2.75% - substantially lower than the 8%+ rates on the bonds.25,26 Gross debt fell to approximately £307 million, and net debt to £247.9 million.28,29
2017: Term Loan Repayment
During FY2017, the club repaid the $233.3 million term loan in full, simplifying the debt structure.42 By June 2017, gross borrowings had fallen to £269 million and net debt to £210.9 million - the lowest levels since the takeover.43,44
2020: COVID-19 and Liquidity Response
The COVID-19 pandemic created significant revenue uncertainty.51 The club drew down on its revolving credit facility, causing gross borrowings to increase to £455.5 million and net debt to £391.3 million - the highest since 2012.52,53
2024–2025: Debt Trajectory Under INEOS
In February 2024, INEOS completed the acquisition of a 27.7% stake for approximately £1.3 billion, gaining control of sporting operations.76 At June 2024, gross financial debt had decreased to £546.6 million.77 By September 2025, an additional £105 million drawn from the revolving credit facility to finance summer transfer activity pushed net debt to £749 million - exceeding $1 billion for the first time.85,88
Evolution of Debt Levels
The table below summarises reported debt levels at fiscal year-end where data is available from official sources.
| Year | Gross Debt | Net Debt | Key Development |
|---|---|---|---|
| 2005 | ~£525M | - | LBO acquisition debt loaded |
| 2009 | ~£700M+ | - | PIK loans compounding at 16.25% |
| 2010 | £509M | ~£480M | Bond issue; PIK repaid |
| 2012 | £423M | £359.7M | NYSE IPO completed |
| 2013 | £307M | £247.9M | Term loan refinancing |
| 2017 | £269M | £210.9M | Term loan repaid - lowest post-2005 |
| 2020 | £455.5M | £391.3M | COVID RCF drawdown |
| 2024 | £546.6M | - | Post-INEOS transaction |
| Sep 2025 | £749M+ | £749M | First time exceeding $1Bn |
Cost of Debt and Financing Impact
Interest Rates by Era
The cost of servicing the club's debt has varied significantly across instruments and eras, declining materially as the Glazer family refinanced into cheaper capital markets debt over time.
| Period | Instrument | Rate |
|---|---|---|
| 2005–2010 | PIK loans | 14.25%, rising to 16.25%47 |
| 2010–2013 | Senior secured bonds | 8.75% (GBP) / 8.375% (USD)12 |
| 2013–2017 | Term loan | LIBOR + 2.75%26 |
| 2022–present | Senior secured notes | 3.79% (USD, 2027)80 |
Cumulative Cost Estimates
Journalistic analysis suggests total interest payments and financing fees paid by Manchester United between 2005 and 2023 amounted to between £800 million and £1 billion.71 This figure is an estimate - varying methodologies are used across sources - and the figure is documented in greater depth in the Interest Payments entry.
Risk, Liquidity, and Governance Context
Risk Disclosures
The 2012 IPO prospectus contained explicit risk factor disclosures regarding indebtedness, stating that substantial debt could adversely affect financial condition.22 Manchester United's debt has been rated below investment grade by major credit rating agencies.73
Governance Criticism
The Manchester United Supporters' Trust has consistently criticised the debt burden placed on the club and the payment of dividends to the Glazer family while debt remains outstanding.74 Since the 2012 IPO, dividend payments to shareholders have totalled over £150 million.75
INEOS-Era Cost Restructuring
Since INEOS's investment in 2024, the club has undertaken significant cost-cutting measures. Approximately 250 employees were made redundant in the first wave, with a second round bringing total workforce reduction to almost 40% from over 1,100 staff.91,92 Employee benefit expenses fell by 14.1% (£51.5M) to £313.2M in FY2025.93
Key Distinctions in Reporting
Gross debt (or "total borrowings") refers to the face value of outstanding debt instruments on the balance sheet, including drawn amounts under term loans and revolving credit facilities.
Net debt is gross debt minus cash and cash equivalents - the actual debt burden after accounting for available liquid assets.
Finance costs as disclosed in the income statement represent the cash and non-cash costs of servicing debt during the reporting period, including interest payments and may include foreign exchange movements on USD-denominated borrowings.
Summary
Debt has been a structural feature of Manchester United's finances since the 2005 leveraged buyout, when approximately £525 million of acquisition debt was placed directly on the club's balance sheet. Over twenty years, the composition and cost of this debt has evolved through multiple phases: expensive PIK loans compounding through 2010; high-yield bonds through 2013; lower-cost term loans and credit facilities thereafter.
Gross debt declined from approximately £509 million in 2010 to £269 million in 2017 through a combination of IPO proceeds, refinancing, and debt repayment. It subsequently increased, with net debt reaching a record £749 million ($1.002 billion) by September 2025 - the first time the club's debt has exceeded $1 billion.
The debt structure has attracted criticism from supporters and scrutiny from analysts, particularly regarding cumulative interest costs and dividend payments made while debt remained outstanding. The evidence on these questions is documented separately in the Interest Payments, Dividends, and Cash Extraction entries.
References
- 1.The Guardian (2005). Glazers complete Manchester United takeover. theguardian.com
- 2.Financial Times (2005). Manchester United takeover financing. ft.com
- 3.Reuters (2005). JP Morgan leads United financing. reuters.com
- 4.The Guardian (2005). United saddled with expensive PIK debt. theguardian.com
- 5.Financial Times (2006). United debt burden grows. ft.com
- 6.Manchester United (2006). Annual Report 2005/06. ir.manutd.com
- 7.The Guardian (2006). United PIK rate rises to 16.25%. theguardian.com
- 8.Financial Times (2007). United debt analysis. ft.com
- 9.The Guardian (2009). United face debt refinancing challenge. theguardian.com
- 10.BBC (2009). United debt hits £700m. bbc.co.uk
- 11.Financial Times (2010). Manchester United £500m bond issue. ft.com
- 12.Reuters (2010). United bond terms revealed. reuters.com
- 13.The Guardian (2010). Glazers pay off PIK loans using bond proceeds. theguardian.com
- 17–22.Manchester United (2012). F-1 Registration / IPO Prospectus. SEC EDGAR
- 25–55.Manchester United (2013–2020). Form 20-F Annual Reports. SEC EDGAR
- 69.BBC (2024). Glazers retain United control after INEOS deal. bbc.co.uk
- 71.The Guardian (2023). The total cost of Glazer debt. theguardian.com
- 73.Reuters (2012). United below-investment-grade credit rating. reuters.com
- 74.Manchester United Supporters' Trust / The Guardian (2022). Fan protest regarding Glazer ownership. theguardian.com
- 75.Financial Times (2023). United dividend payments under scrutiny. ft.com
- 76.BBC / Reuters (2024). INEOS completes 27.7% Manchester United stake acquisition. bbc.co.uk
- 77.Manchester United (2024). Form 20-F FY2024 / 4Q24 Earnings Release. ir.manutd.com
- 80–82.Manchester United (2025). Form 20-F FY2025 / 4Q25 Earnings Release. ir.manutd.com
- 85.ESPN (2025). Man United net debt breaks $1bn after active summer window. espn.com
- 86–87.BusinessWire (2025). Manchester United Q1 FY2026 Earnings Release. businesswire.com
- 88.Inside World Football (2025). Man Utd debt spirals past $1bn. insideworldfootball.com
- 91–93.Sky Sports / Manchester United (2025). Manchester United finances FY2024/25; workforce reduction. skysports.com