Overview
Interest payments became a defining financial characteristic of Manchester United following the Glazer family's acquisition of the club in May 2005. Prior to the takeover, Manchester United was effectively debt-free.1 The acquisition was structured as a leveraged buyout, placing approximately £525 million of debt directly onto the club's balance sheet.2 This placed the burden of debt servicing on the club's revenues rather than the owners' personal assets.
The club's board had warned in April 2005 that the proposed debt level was "not prudent" and risked a "downward spiral in both team and financial performance."3 Interest payments subsequently became a recurring and material cash outflow for nearly two decades.
Debt Instruments and Interest Rates
PIK Loans (2005–2010)
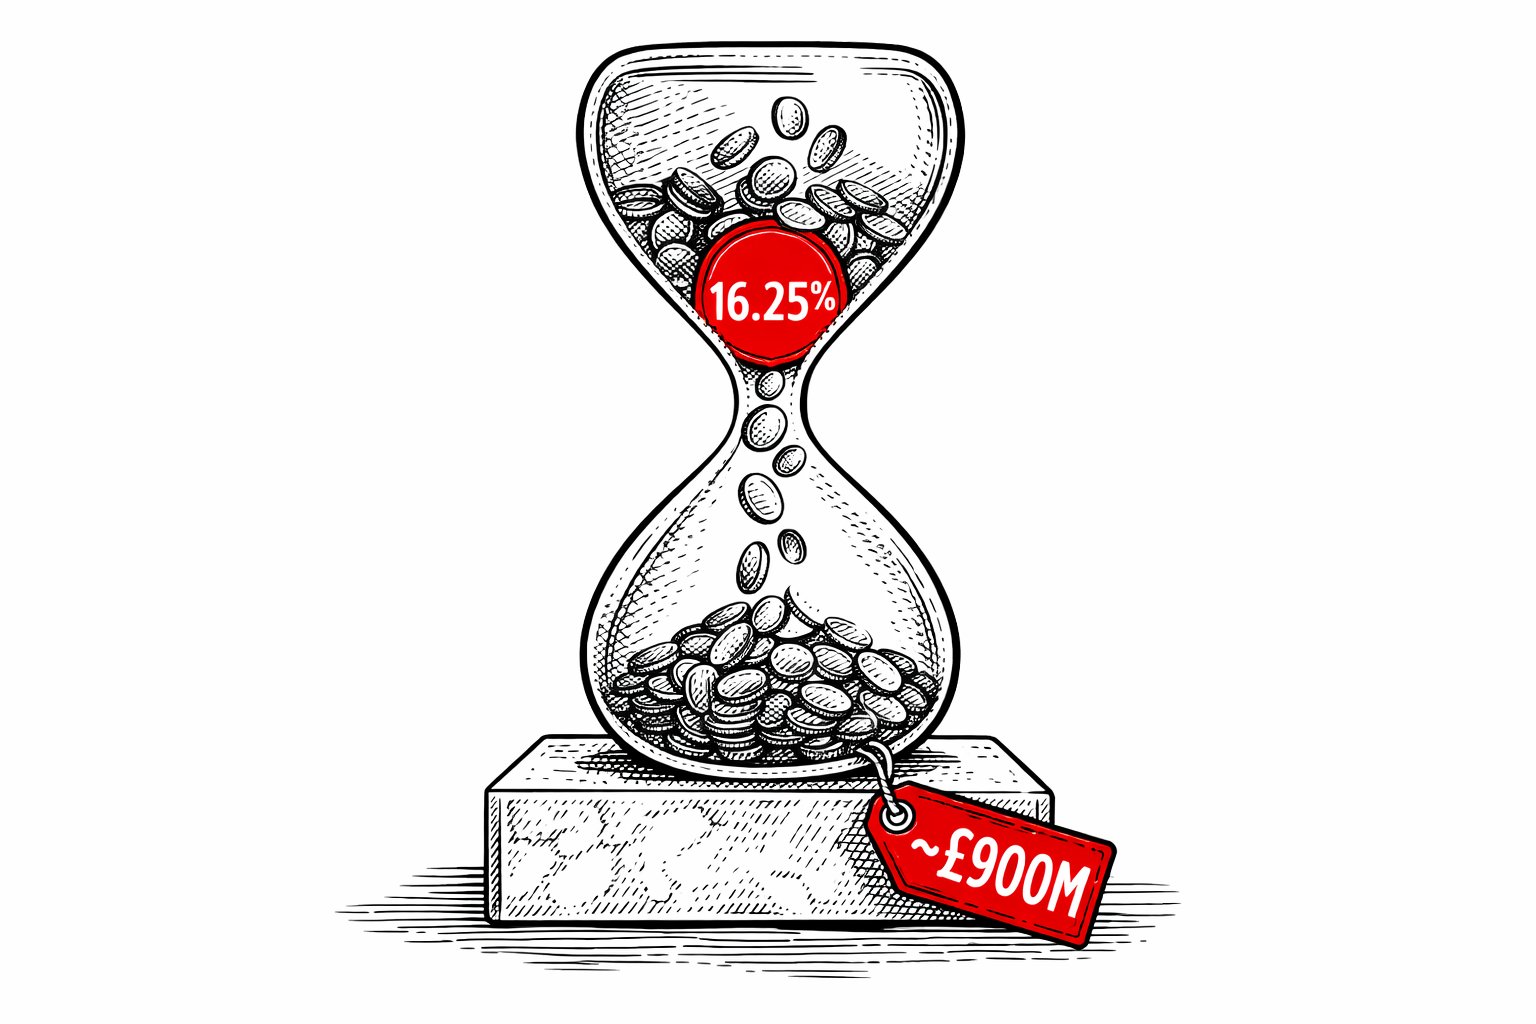
A portion of the acquisition financing consisted of payment-in-kind (PIK) loans, initially totalling approximately £138 million.4 PIK loans are a form of high-yield debt where interest is not paid in cash but compounds and is added to the principal balance. The PIK loans carried an interest rate of 14.25%, subsequently increased to 16.25% per annum.5 Due to this compounding structure, the PIK loan balance grew from approximately £138 million to £220 million by the time of repayment in November 2010 - an increase of approximately £82 million attributable to accrued interest.6
Senior Secured Bonds (2010–2015)
In January 2010, Manchester United issued £500 million in senior secured bonds to refinance the bank debt.7 The bond issuance comprised two tranches: £250 million of sterling bonds at a fixed coupon of 8.75%, and $425 million of dollar bonds at 8.375%.8 Both had seven-year maturities. While fixed rates provided certainty, they remained elevated by historical standards.
Senior Secured Notes (2015–Present)
In June 2015, Manchester United completed a major refinancing. The 2010 bonds were fully redeemed and replaced with $425 million in new senior secured notes at a fixed coupon of 3.79% - a reduction of over four percentage points from the prior bond rates.9 The notes mature on 25 June 2027. Manchester United announced the transaction was expected to reduce interest costs by approximately $10 million per year.10
Annual Finance Costs 2006–2025
Annual finance costs reported in Manchester United's accounts fluctuated significantly across the post-takeover period, reflecting changes in debt structure, interest rates, and foreign exchange movements on dollar-denominated obligations.
| FY | Finance Cost | Key Driver |
|---|---|---|
| 2006 | £62.0M | Bank debt + PIK compounding |
| 2007 | £69.3M | PIK rising |
| 2008 | £81.1M | Peak - PIK at 16.25% |
| 2009 | £69.6M | Financial crisis context |
| 2010 | £40.7M | Transition - bond issue Jan 2010 |
| 2011–2012 | ~£52M | Bond era - 8.75% / 8.375% |
| 2014–2015 | £24–27M | Debt reduction via IPO proceeds |
| 2016 | £17.7M | Lowest post-takeover - 2015 refinancing |
| 2019–2023 | £24–33M | Rising rates + COVID RCF drawdown |
| 2024–2025 | £37.2M | Cash interest stable; net varies with FX |
Cumulative Cost
The cumulative interest burden since the 2005 leveraged buyout is one of the most cited figures in analysis of the Glazer era. Several analysts and journalists have attempted to quantify it, producing estimates that vary with methodology.
Swiss Ramble, working from company filings, calculated gross interest of £776 million paid between 2005 and 2023.11 Including pre-2006 charges and the period through to FY2025, the total from official filings approaches £790 million. Estimates of approximately £900 million incorporate additional financing fees, arrangement costs, and the PIK compounding amount.12
Refinancing and Cost Reduction
The 2015 refinancing represented the most significant reduction in interest costs, replacing 8.375–8.75% bonds with notes at 3.79%.9 However, refinancing reduced annual costs without eliminating the underlying debt. As of June 2025, Manchester United's debt facilities comprised $425 million in senior secured notes maturing June 2027 and a $225 million term loan repayable August 2029.13
Reported debt reductions in FY2025 were attributable to currency movements - the gross debt fell by approximately £39 million to £471.9 million due to exchange rate changes between sterling and the US dollar - rather than actual paydown.14
Context and Criticism
Prior to the takeover, Manchester United was debt-free and generating significant operating cash flow.1 The board's April 2005 warning that the proposed debt level risked a "downward spiral in both team and financial performance" is the most cited contemporary assessment of the acquisition's financial risk.3
BBC Verify analysis published in June 2025 calculated that £1.187 billion in total cash had left the club between 2005 and 2024, comprising debt interest, debt repayments, dividends, and fees to the Glazer family.15 Interest payments represent the largest single component of this total.
Summary
Interest payments on Glazer-era acquisition debt have been a material and recurring cash outflow at Manchester United since 2005. Annual finance costs peaked at £81.1 million in FY2008 during the PIK compounding period, then moderated through successive refinancings to a low of £17.7 million in FY2016. Rising interest rates and increased RCF utilisation have returned the annual cash interest cost to £37.2 million as of FY2025.
From reported official filings, cumulative finance costs from FY2006 to FY2025 total approximately £788 million. Estimates incorporating earlier period costs, arrangement fees, and PIK compounding additions produce figures approaching £900 million. The underlying debt that generates these costs remains on the balance sheet - the refinancing journey has reduced the annual rate significantly but has not eliminated the structural obligation.
References
- 1.The Guardian (2005). Manchester United debt-free before Glazer takeover. theguardian.com
- 2.Financial Times (2005). Glazer LBO debt structure. ft.com
- 3.Manchester United Board (April 2005). Statement on proposed debt level - "not prudent." Multiple sources.
- 4.The Guardian (2005). PIK loan structure - £138M at 14.25%. theguardian.com
- 5.The Guardian (2006). PIK rate increased to 16.25%. theguardian.com
- 6.Manchester United (2010). Annual Report - PIK balance at repayment: ~£220M. ir.manutd.com
- 7.Financial Times (2010). Manchester United £500M bond issue. ft.com
- 8.Reuters (2010). Bond terms: £250M at 8.75%; $425M at 8.375%. reuters.com
- 9.Manchester United (2015). Refinancing announcement - new notes at 3.79%. ir.manutd.com
- 10.Manchester United (2015). Expected annual interest saving of ~$10M. ir.manutd.com
- 11.Swiss Ramble (2023). Cumulative gross interest £776M, 2005–2023. @SwissRamble
- 12.Multiple analysts (various). Estimates ~£800M–£900M including fees and PIK compounding.
- 13.Manchester United (2025). Form 20-F FY2025 - debt facilities: $425M notes (2027), $225M term loan (2029). ir.manutd.com
- 14.Manchester United (2025). FY2025 earnings - £39M debt reduction attributable to FX movements. ir.manutd.com
- 15.BBC Verify / Yahoo Finance (2025). £1.187Bn total cash outflow 2005–2024. finance.yahoo.com