Overview
Manchester United's matchday revenue — the income generated from home fixtures at Old Trafford, including ticket sales, hospitality, and match-day commercial activity — is the most directly stadium-dependent of the club's three revenue streams. Unlike broadcast rights (allocated by Premier League and UEFA) or commercial revenue (driven by sponsorship and retail), matchday revenue is almost entirely a function of two variables: how many home games are played, and how much the stadium can yield per event.
Old Trafford's capacity has not changed materially since May 2006. The stadium runs at over 99% occupancy for Premier League matches. The demand is not the constraint. The bricks are.
This entry documents 20 years of matchday revenue data, the structural ceiling that explains its trajectory, the competitive comparison that reveals what that ceiling has cost, and the new stadium project that frames the next 20 years.
Twenty Years of Matchday Revenue
Manchester United's matchday revenue in FY2007 was £92.6 million — approximately 41% of total operating revenue of £224 million. By FY2025 it had reached £160.3 million, a 73% nominal increase over 18 years. The headline growth, however, obscures a more complicated pattern that only becomes visible when the full series is examined.
From FY2011 to FY2019 — eight consecutive fiscal years — matchday revenue moved between £98.7 million and £111.6 million. It never broke through the £112 million ceiling. The only material variations within that band were caused by fixture count: more home games in a Champions League run produced a higher number; an early group stage exit or domestic cup exit in the same season produced a lower one. No structural growth occurred. The plateau was not a planning target. It was an imposed limit.
The COVID season (FY2021) produced the most extreme data point in the series: £7.1 million in matchday revenue from 33 home matches played entirely behind closed doors. The figure is not analytically interesting for its scale — the cause is obvious — but it is analytically useful as a stress test. It confirms that matchday revenue at Old Trafford has effectively no floor. Remove physical attendance and the revenue disappears almost entirely, regardless of brand strength, global following, or commercial sophistication.
Post-COVID, matchday revenue recovered — but the recovery tells the same structural story as the pre-COVID plateau. The increases from FY2022 to FY2025 (£110.5m → £136.4m → £137.1m → £160.3m) were driven by additional home games, not by structural yield improvements. The FY2025 record of £160.3 million was achieved with 5 more home games than FY2024, including a Europa League run to the final. When that fixture count falls — as it will in FY2026, with only 20 competitive home games and no European football — the forecast decline is approximately 27% to around £118 million.10
The Structural Ceiling: Old Trafford Since 2006
The last structural expansion of Old Trafford was completed in May 2006, adding approximately 8,000 seats in north-west and north-east corner quadrants to bring the stadium to its current capacity of approximately 74,000. That work was approved and funded before Malcolm Glazer completed the leveraged buyout in June 2005. In the 19 years since, no significant structural development has been undertaken at Old Trafford.19
Manchester United's own SEC filings note that the club has averaged over 99% occupancy at Premier League matches for more than 21 consecutive seasons.20 The stadium is sold out. There is no pricing or marketing intervention that can materially increase matchday revenue at a 74,000-seat venue that already runs at capacity. The only levers available are ticket price increases, hospitality upgrades within existing space, and — most significantly — playing more home games.
The fixture count sensitivity was confirmed by Matchday Finance's analysis of FY2023-24: United's matchday revenue rose by just £1 million overall, but this masked a £20 million decline from hosting nine fewer home games, offset by £21 million in price-driven growth.23 The price lever is real but finite. The games lever is determined by the draw.
Kieran Maguire, University of Liverpool football finance analyst, stated in 2023 at the point of United's then-record matchday figure: "After plateauing for around about a decade, this is a significant increase as far as matchday revenue is concerned... However, to fulfil that potential they need to address their 20th century stadium in 2023. It's not fit for purpose."21
The Per-Seat Yield Gap
The most structurally significant comparison in the matchday data is not the total revenue comparison — it is the per-seat yield comparison. In FY2023-24, Manchester United generated £137 million in matchday revenue from 74,000 seats, implying approximately £1,850 per seat per year. Arsenal generated £132 million from 60,260 seats at the Emirates Stadium — approximately £2,190 per seat per year.18
Arsenal's stadium is 19% smaller. Arsenal's matchday yield is 18% higher per seat. A smaller stadium earning more per fan than the largest club ground in England.
The explanation is not pricing alone — Arsenal's average ticket prices are broadly comparable to United's. It is the physical infrastructure of the stadium: modern hospitality facilities, premium and corporate suite density, food and beverage infrastructure, and non-matchday revenue from the stadium itself. The Emirates was purpose-built for a modern revenue model. Old Trafford was not.
The UEFA European Club Finance benchmarking report for FY2023-24 confirmed the same finding from European data: Arsenal's gate receipts of €153 million were the highest of any English club, ahead of Manchester United at €129 million — despite the Emirates being substantially smaller.17
The Competitive Collapse: Liverpool, Arsenal, and the Money League
The Deloitte Football Money League has tracked club revenues annually since 1997. In the 2026 edition — covering FY2024-25 — Manchester United were ranked 8th overall, their lowest position in the publication's 29-year history. For the first time, they were not the top English club. Liverpool (5th, €836m) overtook them. Arsenal (7th) also ranked above them.14
Tim Bridge, Sports Business Group Leader at Deloitte, made the structural point directly at the Money League launch: "If you went back 10 or 15 years, and you looked at Manchester United's matchday revenue it was the industry leader. If you looked at their ability to generate commercial revenue, it was the benchmark by which everybody then went to market and set their strategy. I don't think that remains the case. The opportunity remains for Manchester United. They are arguably still the biggest global football club brand, and therefore they have the opportunity to maximise that in a way that is only possible for a select few... But to do that requires fit-for-purpose facilities."16
Liverpool's trajectory illustrates the compounding effect of stadium investment. Their Anfield Road Stand expansion, completed in time for the 2023-24 season, increased capacity from approximately 53,000 to 61,000 and introduced new hospitality offerings. By FY2023-24, Liverpool's matchday revenue had reached £102 million — closing a gap that had once been substantial. By FY2024-25, Liverpool ranked above United in the Money League for the first time in that publication's history.
The Arsenal comparison is longer-standing. Arsenal relocated from Highbury to the Emirates Stadium in 2006 — the same year as Old Trafford's last expansion. In FY2014, both clubs generated approximately £87–88 million in matchday revenue. Ten years later, Arsenal had reached £132 million from a stadium 14,000 seats smaller than Old Trafford. The yield gap — more revenue per fan from a modern facility — had become a structural advantage.31
The New Stadium: Case and Risk
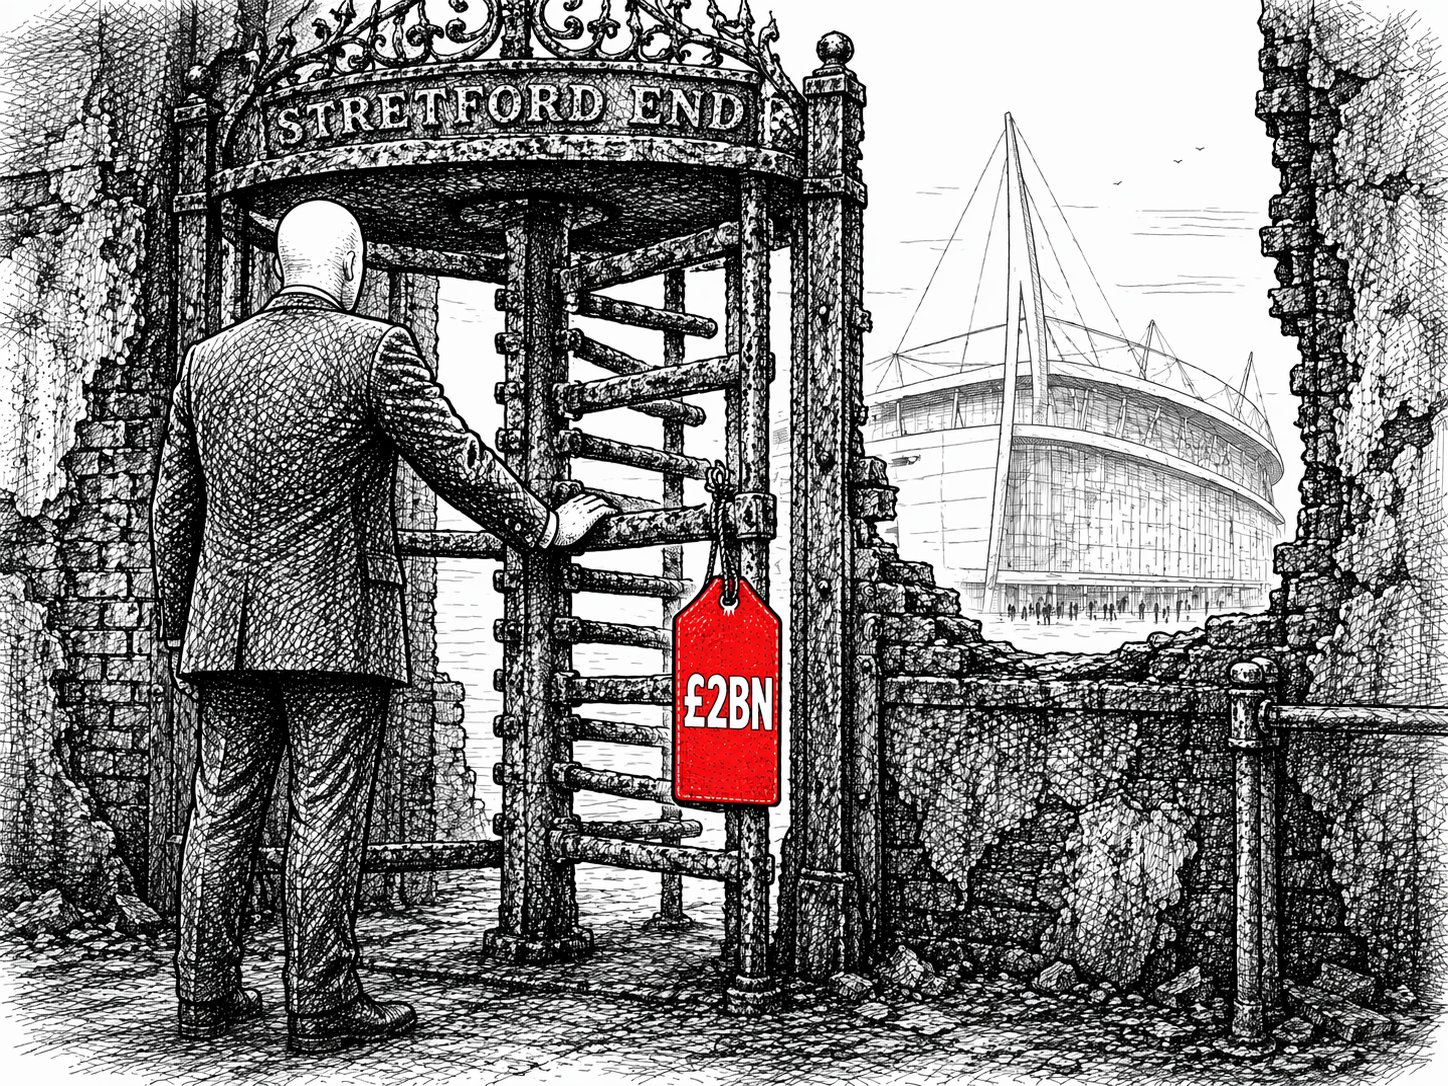
On 11 March 2025, Manchester United announced plans to replace Old Trafford with a new 100,000-seat stadium designed by Foster + Partners, to be built on adjacent land. The estimated cost was approximately £2 billion, with a projected completion of 2030-31. The announcement followed an extensive consultation process on whether to renovate the existing stadium (estimated at up to £1.5 billion) or build new.24
The revenue case is straightforward to state, if not to verify. A 100,000-seat stadium with modern hospitality infrastructure would represent a 35% increase in capacity over Old Trafford's current 74,000. At Arsenal's per-seat yield of approximately £2,190 — itself not the most efficient benchmark in the Premier League — a 100,000-seat stadium would generate approximately £219 million annually in matchday revenue before accounting for non-matchday events. At a higher per-seat yield reflecting premium infrastructure, £250 million annually is plausible. The uplift over the current structural ceiling would be material and permanent.
The financing risk is more complex. Bloomberg reported in March 2025 that lenders could provide between £1 billion and £1.5 billion of debt — leaving a gap of £500 million to £1 billion to be filled with equity or other instruments. Manchester United carried existing debt of approximately £1.3 billion at the time of announcement. CEO Omar Berrada stated he was "quite confident we'll find a way to finance the stadium" while acknowledging it remained to be determined.25
Industry estimates reported by StadiumDB in March 2026 suggested construction inflation could push the final cost above £3 billion, with the signature tent-like roof alone costed at approximately £200 million — a component under active review for removal. The timeline also assumes a five-year construction programme, during which Old Trafford continues operating. Manchester United would play no matches at the new stadium until at least 2030-31 under the current schedule.26
The club has also explored a Personal Seat Licence model — a mechanism common in American sports in which fans pay a one-off fee (up to £4,000 per seat) for 30-year priority rights to purchase a season ticket — as a potential capital-raising mechanism. Such a scheme would be unprecedented in English football and was described by Manchester United Supporters' Trust as raising fundamental questions about affordability and access for local supporters.2829
Summary
Manchester United's matchday revenue trajectory between FY2007 and FY2025 documents 18 years of extraction from a fixed asset. The stadium ran at over 99% capacity throughout, ticket prices increased steadily, and hospitality offerings were optimised within the constraints of a 115-year-old structure. From FY2011 to FY2019, the result was eight years of revenue in a band between £98.7 million and £111.6 million — a plateau that no amount of pricing sophistication could escape, because the ceiling was physical.
In the same period, Arsenal built the yield advantage that has now made them a peer in matchday revenue despite a stadium 14,000 seats smaller. Liverpool expanded Anfield and overtook United in the Deloitte Money League for the first time in its history. Tottenham built an entirely new stadium. Manchester City doubled their per-seat yield through a series of Etihad expansions. United's last structural change to Old Trafford — the north-west and north-east quadrant additions — was approved before the Glazer family took operational control.
The new stadium announcement of March 2025 is the acknowledgement that the fixed-asset extraction model has reached its limit. Whether the £2 billion (or more) required to build what replaces it can be financed without materially worsening the debt position that has constrained the club since 2005 is the question the 20-year matchday chart poses, but cannot answer.
This entry documents the revenue figures, the structural constraint, and the competitive consequence. The financing and governance of the stadium project are addressed in the Debt Structure and Capital Expenditure entries.
References
- 1.Rocketfan / Manchester United Limited (2007–2008). Annual accounts year ended 30 June 2007 and 2008. rocketfan.com
- 3.Manchester United plc (2013). Form 20-F, period ending 30 June 2013. ir.manutd.com
- 4.City A.M. / UEFA (2014). Arsenal generated second highest gate receipts revenue in Europe ahead of Manchester United. cityam.com
- 5.Manchester United plc (2019). Business Model — Investor Relations. ir.manutd.com
- 7.The Business Desk (2021). Manchester United losses widen in club's most challenging year. thebusinessdesk.com
- 8.The Stadium Business (2023). Manchester United posts record revenue of £648.4m. thestadiumbusiness.com
- 9.Manchester United plc (2025). Fourth Quarter and Full Year Fiscal 2025 Earnings Release. ir.manutd.com
- 10.FootyFinance Substack (2026). Manchester United Financial Forecast. footyfinance.substack.com
- 11.The Sports Journal / Sponsorlytix (2024). Premier League Football Clubs Matchday Revenue Data 2022/23. sportsjournal.io
- 14.Deloitte (2026). Football Money League 2026. deloitte.com/uk
- 15.Goal.com (2026). Deloitte Football Money League 2026: top 20 highest revenue-generating clubs. goal.com
- 16.Sky Sports / Deloitte (2026). Deloitte Football Money League — Man Utd fall to lowest position. Tim Bridge quote. skysports.com
- 17.Transfermarkt / UEFA (2025). Arsenal top PL club: Highest revenue from ticket sales. UEFA European Club Finance and Investment Landscape 2023/24. transfermarkt.us
- 18.Swiss Ramble (2025). England Club Finances 2023/24. swissramble.substack.com
- 19.StadiumDB / Sky Sports (2024–2025). Old Trafford expansion history; Manchester United stadium plans. stadiumdb.com
- 20.Manchester United plc (2019). Business Model — Investor Relations. 99%+ occupancy statement. ir.manutd.com
- 21.Kieran Maguire / Football Insider (2023). Maguire makes 'sensational' Man United claim after record-breaking £136m reveal. footballinsider247.com
- 23.Matchday Finance (2025). Premier League Financial Results Season 2023/24. matchdayfinance.com
- 24.ESPN / Manchester United plc (2025). Man United to leave Old Trafford for new 100,000-seat stadium. espn.com
- 25.Bloomberg (2025). Manchester United's Stadium Is a £2 Billion Debt-Powered Gamble. bloomberg.com
- 26.StadiumDB (2026). Manchester United problems: new stadium getting more expensive, timeline extending. stadiumdb.com
- 28.StadiumDB (2025). Manchester United considering controversial PSL funding model for new stadium. stadiumdb.com
- 29.Manchester United Supporters' Trust / Jordan Times / AFP (2025). Manchester United to leave Old Trafford for new stadium. MUST response. jordantimes.com
- 31.City A.M. (2014) / Swiss Ramble (2024). Arsenal vs Manchester United matchday comparison FY2014 and FY2023-24. Derived comparison across two primary sources. cityam.com